
Automated monitoring of aquaculture facilities in Bali
Using automatic classification of satellite images in GIS to monitor the status of aquaculture facilities in Bali
Aquaculture is a modern actively developing direction in the farming, including the cultivation of fish, shellfish and algae that can be used for food, production and other purposes. Most of aquaculture farms are situated in Asia, and Central and South America.
Indonesia, as an archipelagic country, has an extensive coastline. The area utilized for brackishwater farming was estimated at 0.6 million ha in 2012. The available surface for brackishwater aquaculture was 2.3 million ha.
However, the aquaculture development has enormous environmental and socio-economic impacts at production sites, including the destruction of mangrove forests, salinization of coastal and agricultural lands, loss of genetic diversity in shrimp populations, conflicts and violence over land rights, access to natural resources, and coastal water pollutions.
According to various estimates, production by aquaculture methods can grow significantly. Consequently, useful tools need to be developed to improve the sustainability of aquaculture farming, the preservation of coastal resources and the management of human activities.
One of the most effective modern tools for monitoring the state of various objects is GIS. Geographic Information System (GIS) is a database that stores information that has not only temporal, but also spatial reference. A characteristic feature of GIS is the ability to summarize spatial data of large coverage (for example, satellite images) and long time series of heterogeneous data.
For aquaculture, GIS can be used to monitor the status of existing facilities, make decisions about their effective use, and achieve the goal of sustainable development. In addition, you can find the best places for the construction of new aquaculture facilities at minimal cost.
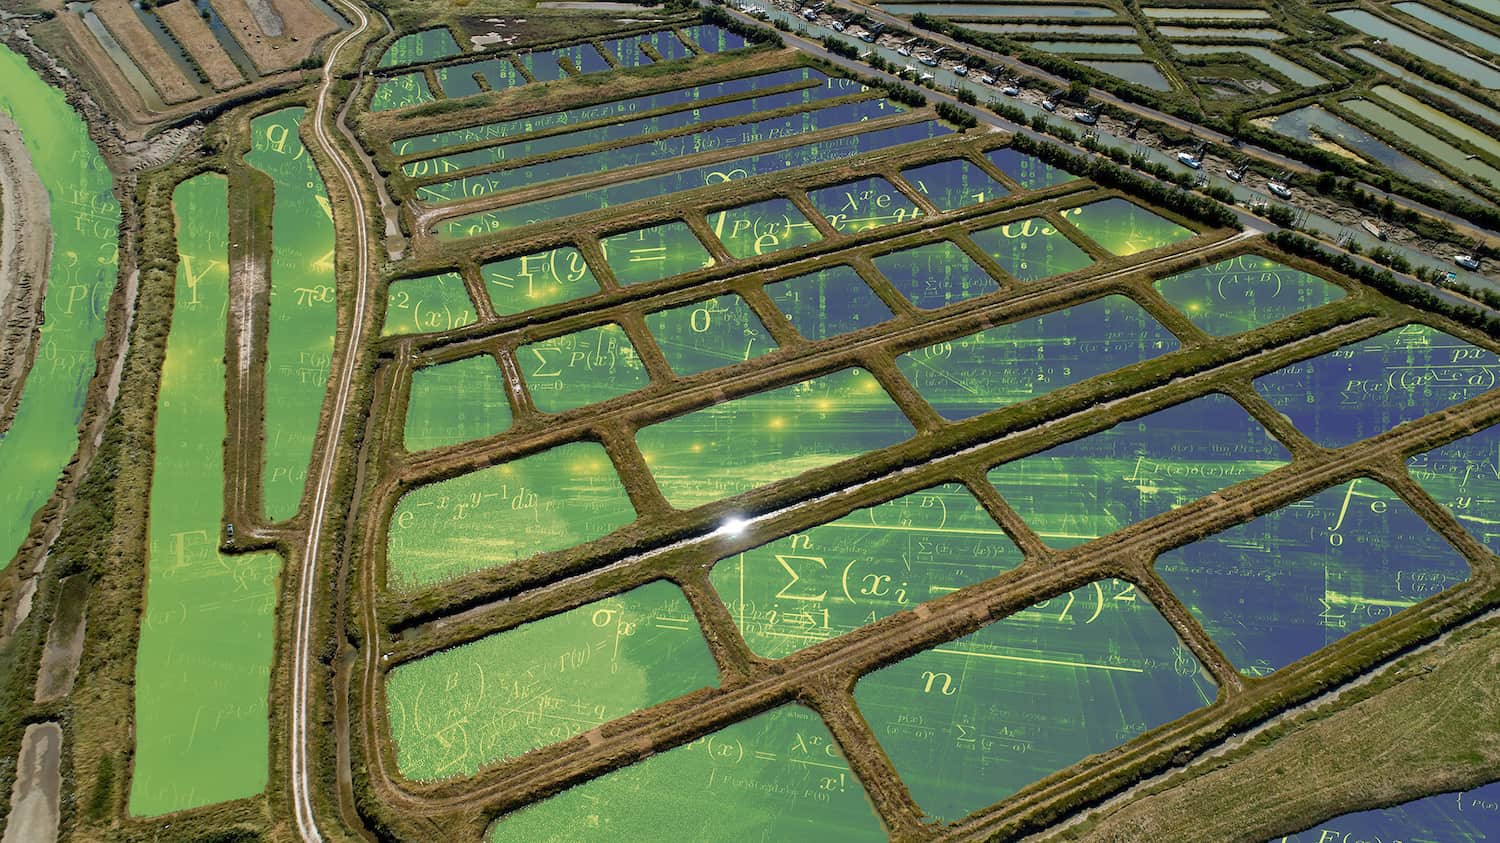
Using the Perancak estuary system (Bali, Indonesia) as an example, the possibilities of creating a map of the aquaculture pond system using satellite imagery are considered. They included active shrimp ponds in traditional, semi-intensive and intensive culture systems; abandoned shrimp ponds with water, without water, with natural vegetation and mangrove plantation conditions; fish ponds; and polyculture ponds (algae/fish and shrimp).
As a result of automatic recognition of the image by statistical cross-sections of GIS, it was possible to create a map of aquacultural ponds with fairly high accuracy. This methodology could be utilized in aquaculture mapping for intensive and super-intensive farms that have homogeneous water and clear boundaries of embankments.

Aquaculture map obtained using GIS
In some cases, when automatic creation of a map of ponds along the boundaries of water bodies in the GIS is not enough, it is possible to refine the resulting contours with the help of additional analysis, such as vegetation cover. Therefore, classification by vegetation indices might be useful for that application and should thus be integrated into the mapping process.
Full Text:
Gusmawati N. F. et al. Aquaculture Pond Precise Mapping in Perancak Estuary, Bali, Indonesia //Journal of Coastal Research. – 2016. – V. 75. – N. sp1. – P. 637-641.
https://www.jcronline.org/doi/abs/10.2112/SI75-128.1